UDRC Accessible Color Palettes: Expanding Access to Public Data
Executive Summary
The Utah Data Research Center’s research reports and dashboards serve a wide public audience, from policymakers to Utah residents. As readership grew, so did complaints—many users with color blindness could not make sense of the site’s charts and maps. The problem was the color palette: red and green, a classic but inaccessible combination. When the UDRC manager asked for help, I led the design and rollout of four new color palettes, each tested and validated for accessibility, legibility, and clarity. These palettes now power all Tableau and R data visualizations on the UDRC website, making metrics understandable for everyone, and have set a new accessibility standard for Utah government data.
Background
UDRC’s mission is to make complex state data clear and useful for Utah’s people. The website offers interactive charts, geographic maps, and detailed research reports. However, visualizations used a traditional red-green palette—a choice that made critical insights invisible for readers with color blindness.
As UDRC’s research reached a broader audience, complaints started coming in. Readers, including policymakers, reported they could not interpret performance metrics or trend charts. The UDRC manager recognized this as a significant barrier and requested a comprehensive accessibility update.
My Role
The UDRC manager brought me in because of my background in accessible, research-driven design. I led the entire overhaul of the color system: diagnosing the problems, researching and designing new palettes, testing them, and ensuring a seamless rollout. This included working closely with the manager, the data analysts, and end users—including readers with various types of color blindness.
The Problem
The old red-green palette failed users with color blindness, making it nearly impossible to distinguish key findings or interpret trends. In usability tests, users often could not tell positive from negative metrics, or missed important signals. Complaints came in directly, with readers expressing frustration and even exclusion from vital state research. UDRC needed not just technical compliance, but true clarity for everyone.
Research and Discovery
I began by auditing the site’s charts, dashboards, and maps, using color blindness simulators in Figma and Adobe Color to pinpoint failures. These tools showed how, for users with common types of color blindness, red and green appeared nearly identical, washing out vital differences in the data.
But the real breakthrough came from user research. I involved analysts and readers in usability sessions, using real UDRC research outputs. Many described not just confusion, but a sense that the site was not made for them. Users even suggested color pairings they knew worked for their own needs, reinforcing the idea that a single new palette would not be enough.
The Design Process
In partnership with the UDRC manager, I determined that four new palettes were needed to support the range of visualizations generated from Tableau and R. Over two weeks, I explored dozens of color combinations, using technical tools and user feedback to refine each option.
I collaborated with the data team to ensure every palette would work for the types of charts, maps, and summaries used by UDRC. Using Figma plugins and Adobe Color, I tested every candidate palette for contrast and clarity, checking against all major types of color blindness and ensuring every color passed WCAG standards.
Palette Development
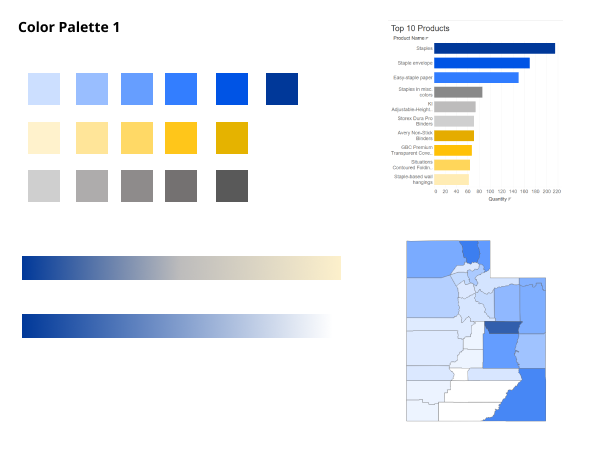
- Palette 1: Blue, gold, and gray—provides clarity in line and bar charts and offers a strong neutral for comparisons.
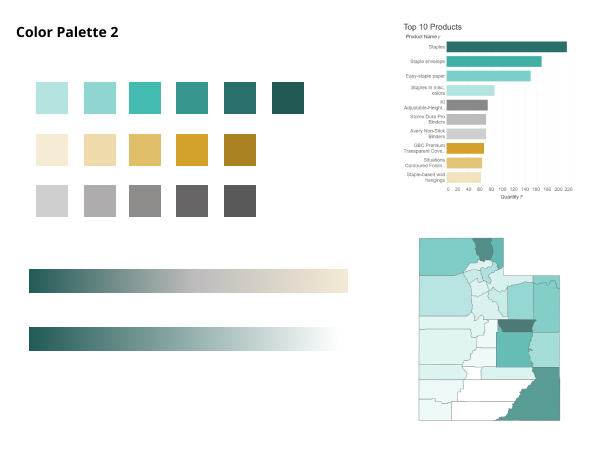
- Palette 2: Teal, earth tone, and gray—ideal for maps and categorical data, with earth tones analysts requested for geographic visualizations.
- Palette 3: Blue, orange, and gray—offers high contrast and a modern feel, especially for trend lines and summary tables.
- Palette 4: Blue and gray—optimized for simple comparisons with just two categories.
Each palette was developed to ensure clear differences and valence in the data, no matter the user’s vision.
Prototyping and Approval
I created summary documents for each palette, showing before-and-after examples and real chart scenarios. These were presented to UDRC leadership, alongside technical evidence from Figma and Adobe Color showing color blindness simulation results. The approval was swift and enthusiastic—the side-by-side comparisons made the improvement obvious.
Why Accessible Palettes Matter: A Visual Comparison
To demonstrate the impact, I created a side-by-side bar chart comparison using a classic red-green palette and Palette 1. The left side shows each chart as seen by users with typical color vision; the right simulates red-green color blindness (deuteranopia). Notice that in the red-green palette color blindness example, colors B and C are both gray. Seemingly using two grays to show differences often caused confusion. In the accessible version, all categories remain clearly visible.

Implementation and Example Palettes
Once approved, I created ready-to-use swatches and style sheets for the analysts, making it easy to use the new palettes in Tableau and R. I wrote simple guides for applying the right palette to the right visualization, and analysts quickly adopted the new standards. Every new UDRC report now uses one of the four accessible palettes.
Palette 1: Blue, gold, and gray

Palette 2: Teal, earth tone, and gray

Palette 3: Blue, orange, and gray

Palette 4: Blue and gray

Outcome and Impact
The impact was immediate and visible. Public complaints about color confusion stopped. Analysts and readers could finally understand the research findings at a glance, regardless of vision. Even fully sighted users found the new palettes more readable and professional. The UDRC manager credited the redesign with making the center’s research more inclusive and effective—and other state agencies began reaching out for advice on their own palette updates.
Reflection
This project reinforced for me that accessible design is not just a compliance requirement, but a practical, ongoing conversation between users and designers. Listening to those who had been excluded by inaccessible charts was both humbling and energizing. The most rewarding feedback came from readers who, for the first time, could follow UDRC’s research without barriers. By pairing technical rigor with real user stories, I helped the UDRC fulfill its mission and set a new benchmark for accessible data in Utah government.